

New York taxi advertising data is campaign-level reporting on who saw your ads, where, and what they drove. Firefly builds it from GPS on its own digital taxi tops — reach by neighborhood, daypart, and point of interest — plus campaign lift measured by comparing exposed and control audiences through mobile ad IDs (MAIDs).
For advertisers, "data" is the difference between buying impressions on faith and buying outcomes you can read in a report. The question isn't whether yellow cabs move through Manhattan — they obviously do. It's what you can actually learn about the audience you reached and the action you drove. This guide walks through the New York taxi advertising data Firefly captures in 2026, how it's measured, and what it means for your budget.
What "New York taxi advertising data" actually means for advertisers
There are two very different things people mean by this phrase. One is open civic data about the taxi system itself — the kind the city's Taxi & Limousine Commission (TLC) publishes about trips and fleets. 1 The other — the one advertisers care about — is campaign data: who your ad reached, when and where, and whether it changed behavior.
As a form of digital out-of-home (DOOH), New York taxi advertising sits in the second category. The data is tied to a campaign, not to the public transportation record. It describes exposure (how many people in which areas were in a position to see your ad) and outcome (what those exposed audiences did afterward, compared with people who weren't exposed). That framing matters, because it's what lets you judge a media buy on performance instead of vibes.
Audience and impression data from the cabs themselves
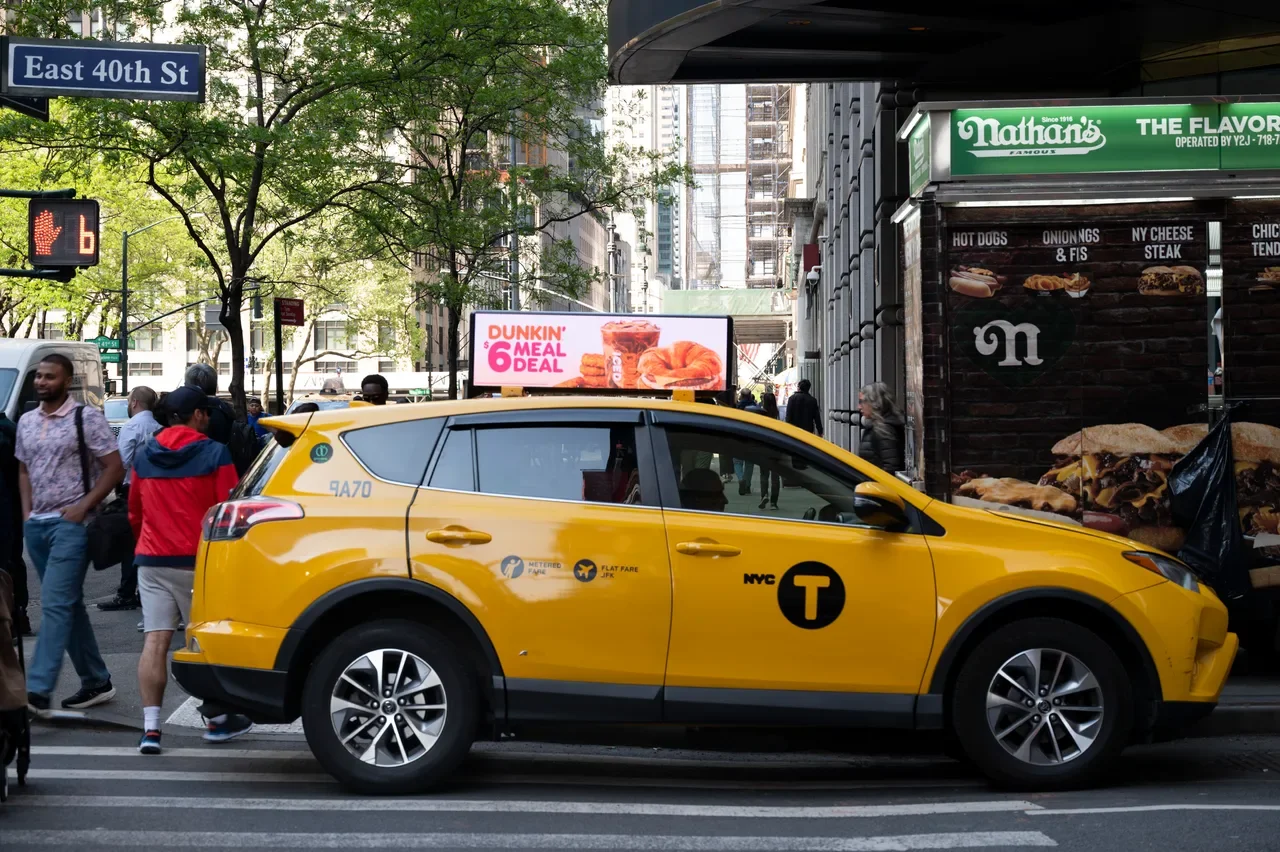
Firefly's data comes from the vehicles you're actually running on. Each digital taxi top carries GPS, so a campaign isn't a guess about "a screen somewhere in the city" — it's a moving record of where your creative traveled and when.
The dimensions you can read
That produces audience and impression data along a few useful dimensions:
| Data point | What it tells an advertiser |
|---|---|
| Location / route | Which neighborhoods and corridors your ads actually traveled through—not just where they were planned to run. |
| Daypart | When exposure occurred, including morning commute, lunch, evening, and late night. |
| Point of interest (POI) | How often ads passed venues that matter to your audience, such as stadiums, retail destinations, and business districts. |
| Impressions | Estimated opportunities for people and vehicles to see your creative throughout the campaign. |
Because the screens are digital and GPS-aware, you can plan around real movement: concentrate spend near the POIs and dayparts that matter, or spread across the city for broad reach. None of this depends on a third-party guess about where taxis go — it's recorded from the fleet running your campaign.
What the data tells you about your ad spend
Good data isn't a vanity report — it changes how you allocate budget. New York taxi advertising data feeds three practical decisions:
1. Efficiency. Because pricing works on a CPM (cost-per-thousand-impressions) basis, knowing your real impression volume by area lets you read CPM against the audiences that actually matter, instead of a blended citywide average.
2. Allocation. Location, daypart, and POI data show where attention concentrates, so you can weight spend toward the corridors and times that perform and pull back where they don't.
3. Scale. The same data that justifies a focused test also supports a citywide program — you scale up on the segments the reporting proves are working, across the city and across any POI that fits the brief.
That's the loop: measure, learn, reallocate, and prove the next budget with the last campaign's numbers. Explore the formats behind it on Firefly's New York taxi advertising page.
The New York taxi advertising database: what exists and what doesn't
Short answer: there's no single public database you can query to plan or grade an ad campaign. The TLC publishes open datasets about the taxi system — trip counts, fleet figures, licensing — but those describe transportation, not advertising exposure or outcomes. 1 Firefly does not build campaign reporting from those trip records.
Instead, the useful "database" for an advertiser is the campaign-specific reporting your media partner provides: the exposure, impression, and lift data tied to your actual run. That's the record that answers your questions, and it's available because the data is collected first-hand from the vehicles carrying your creative. If you want to see what a reporting package covers before you commit, that's a good first conversation to have with Firefly's advertising team.
Used well, New York taxi advertising data turns a high-impact medium into an accountable one — you can show where the audience was, what it did, and why the next dollar should go where it's going.
Frequently asked questions
What data do advertisers get from NYC taxi ads?
You get campaign-level audience and impression data — reach by neighborhood, daypart, and point of interest — plus outcome data showing the behavior change your ads drove. With Firefly, exposure data comes from GPS on the digital taxi tops running your campaign, and outcomes come from an independent exposed-versus-control lift study.
Does Firefly use NYC TLC trip records?
No. Firefly's campaign data is collected first-hand from GPS on its own digital taxi tops. It is not built from the Taxi & Limousine Commission's public trip records, which describe the transportation system rather than advertising exposure or results.
How is campaign lift measured?
Through an exposed-versus-control study run by independent measurement partners. Devices near the running campaign (identified by mobile ad IDs) form the exposed group; a comparable unexposed group is the control. Comparing conversions between them shows the lift, rather than relying on promo codes that capture only a fraction of the audience.
Is there a public New York taxi advertising database?
There's no single public database built for planning or grading an ad campaign. The TLC's open data covers the transportation system, not advertising performance. The data advertisers actually use is the campaign-specific reporting their media partner provides — exposure, impressions, and measured lift for that exact run.
How does the data improve CPM efficiency?
By showing real impression volume and audience concentration by area and daypart, the data lets you judge cost per thousand against the audiences that matter and shift budget toward the segments that perform — so less spend lands on low-value exposure.
What's the difference between impression data and lift data?
Impression and location data tell you where and how often your ad was seen; lift data tells you what it changed — the difference in conversions between exposed and control audiences. You need both: reach proves delivery, lift proves impact.
Sources
4. TLC Trip Record Data — NYC.gov — https://www.nyc.gov/site/tlc/about/tlc-trip-record-data.page
5. Best practices for better conversion lift — The Trade Desk — https://www.thetradedesk.com/resources/best-practices-for-better-conversion-lift
6. Geopath — Out-of-Home Audience Measurement — https://geopath.org/
